
Probability is a quantitative measure of uncertainty. Statistics deals with collecting, analyzing, interpreting and presenting numerical data. Part of its purpose is to summarize what has happened in order to predict what will happen or what might happen. In this way statistics is closely connected with probability, which is the science of predicting the likelihood of events.
For example, If we flip the coin, the probability of getting head is 0.5. This means that, if we toss the coin many times, we expect heads in about 50% of the flips. Probability is a number between 0 and 1. Zero implies the event cannot occur and 1 means that it is absolutely certain to happen. If an event is as likely to occur as not occur, the probability of event occurring is 0.5. There are many methods of calculating probabilities, the simplest ones are based on ratios. The underlying assumption of these methods is the idea that what is probable depends on what is possible. If an experiment (tossing a coin, picking a card from a deck, etc.) has a set of distinct outcomes, each of which is equally likely to occur, then the probability of an event is the ratio of the number of outcomes that constitute the event (getting head, picking diamond, etc.) to the total number of possible outcomes:
In case of tossing coin, the probability of getting the head is:
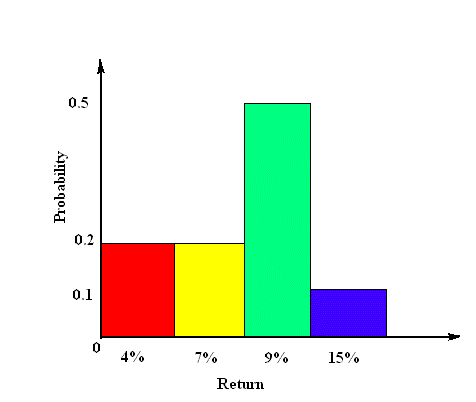
Stock rate of return can be considered as a random variable
because of uncertainty involved. Based on our predictions
of certain events occurring we can formulate a probability
distribution of rate of return. Probabilities can be derived
from our beliefs, mathematical model, financial analysts
recommendation, etc.
For example, for hypothetical stock S:
   		   			Rate of return:		    Probability:
			 	    	    4%				0.2
				    	    7%				0.2
				    	    9%				0.5
				   	    15%				0.1
									----
									1.0

where a, b, c, ... are different outcomes and P(a), P(b), P(c), ... are corresponding probabilities of random variable V. For above numerical example of stock S the expected value equals:
The expected value can be interpreted as a long run average, or in other words, if many outcomes of the random variable can be observed, we would "expect" the average of this outcomes to be approximately equal to the expected value. Other measures of central tendency are mode and median. The mode is the value that is most likely to occur. The median is the value where the random variable is equally likely to occur above it as below it. Although any of these three measures can be used in security analysis, expected value (mean) is the most preferred. The reason is that both, the values and their associated probabilities of the random variable are used in mean calculation and any changes in values and probabilities are reflected in mean.
where a, b, c, ... are different outcomes of random variable V, P(a), P(b), P(c), ... are corresponding probabilities, X is expected value (mean) and "sq" means square. The standard deviation is a square root from variance value:
where "sqrt" means square root.
For above numerical example of stock S the variance and standard deviation
equals:
	Variance(S) = sq(4-8.2)*0.2 + sq(7-8.2)*0.2 + sq(9-8.2)*0.5 + sq(15-8.2)*0.1 =
            	    = sq(-4.2) *0.2 +  sq(-1.2)*0.2 +  sq(0.8 )*0.5 +    sq(6.8)*0.1 =
                    =     17.64*0.2 +      1.44*0.2 +      0.64*0.5 +      46.24*0.1 =
                    =	      3.528 +         0.288 +          0.32 +          4.624 =
                    = 8.76

	Standard Deviation(S) = sqrt( 8.76 ) = 2.96%
Since the variance and standard deviation quantify how far return
values lie from the expected return value, they are used as a measure
of risk for investment.
